- Installation Checklist
- Predefined Projects
- Getting Started
- Build Configurations
- Non-top files
- default.build
- Auto-config
- Simulator Log-config
- Emulating compiler invocations
- Multiple .build Files
- Compatibility Modes
- Paths
- Strings
- Comments
- Environment Variables
- Including Other Argument Files
- Build Persistence
- DVT Auto-Linked
- Run a Script Before Build
- All Build Directives
- e Language Test Files
- e Language SPECMAN_PATH
- SystemVerilog OVM or UVM Library Compilation
- Xilinx Libraries Compilation
- Intel(Altera) Quartus Libraries Compilation
- Questa Libraries Compilation
- Use of External Programs
- Breadcrumb Navigation Bar
- Compile Checks
- Content Assist (Autocomplete)
- Quick Fix Proposals
- Content Filters
- Code Templates
- File Templates
- Project Templates
- Code Formatting
- Inspect Extensions (Layers)
- Inactive Code Highlight
- Semantic Search
- Search for References (Usages)
- Show Instances
- Quick Search in Views
- Refactoring
- External Tools Integration
- Custom Dialogs
- Command Line Interface
- dvt_cli.sh
- Syntax
- Examples
- Makefile Example
- Commands
- Create a Project (Mixed-Language Capable)
- Create a Project From an Existing Template
- Import an Existing Project
- List Compiled Files
- Compare Files
- Launch a Run Configuration
- Open a File
- Close a File
- Open a Custom Dialog
- Open a Perspective
- Refresh a Project
- Rebuild a Project
- Print Edited File
- Quit
- Query the running status
- Print version
- Run Performance Exploration
- Reminders (TODO Markers)
- Settings Management
- Reference
- Comments Formatting
- Common Shortcuts
- Custom Pragmas
- DVT Resource Monitor
- Editor Right Click Menu
- Hyperlinks
- Icons and Decorations
- Lazy Bring up Resources
- Memory Monitor
- Scripts
- Syntax Coloring
- Themes
- Tooltips
- Views
- Application Notes
- Tips and Tricks
- Q & A
- I am new to Eclipse, where should I start from?
- Where can I find DVT Help?
- How do I see and configure the key shortcuts?
- Are there any backup files in Eclipse?
- Workspace in use, cannot launch eclipse...
- Locking is not possible in the directory...
- How to start DVT Eclipse with a different eclipse.ini
- Save could not be completed
- IBM Clearcase Plugin
- How do I Access Files Outside Project Dir - Working with Linked Resources
- Mapping Linux to Windows (/proj/ to Z:\proj\)
- How to use Working Sets for filtering Problems/Task/Search views?
- Subversive vs Subclipse
- How do I associate a project with both DVT and CDT?
- Can I use vi/vim along with DVT?
- Can I perform dos2unix or unix2dos from DVT?
- How can I configure Eclipse to use a local CVS repository?
- I am using the Common Desktop Environment via Citrix and experiencing crashes. What can I do?
- How do I change the background color of the Editor?
- Some widget colors are not displayed properly. What can I do?
- How do I change the tooltip colors?
- How do I change Internet Proxy Settings?
- Eclipse does not start, there is no Workspace, metadata or log file created
- Workspace permissions
- How do I link mylyn with Bugzilla?
- How do I print source code?
- How do I disable Eclipse Software Sites?
- How do I revert to a previous version?
- What are the most common shortcuts in DVT?
- How does DVT integrate with emacs?
- How does DVT integrate with CVS?
- How to set an environment variable within a Run Configuration?
- How to run a remote Unix command from DVT Eclipse for Windows?
- How do I tell DVT to skip some files from compilation?
- Rebuild shortcut (Ctrl + Alt + R) does not work
- I want to use an alias in a DVT Generic Run Configuration, but it's not recognized
- How to set multiple paths as sources of predefined projects ?
- Lines are suddenly changing indentation when I edit text or move the cursor through the editor.
- How to change the directory where the build log file is saved ?
- How to find the DVT logs on Linux/Unix ?
- How to create resource filters ?
- How to create custom shortcut and button for a Run Configuration?
- I know that file.foo is present in the project location, but I can't see it in the Navigator View
- How to copy the full path to the file in the current editor?
- How to adjust the console logs filters matching parameters?
- When I switch to Block (Column) Selection mode the font changes
- In Block (Column) Selection mode I see strange editng artifacts
- How to modify the font size in the code editors?
- How to automatically checkout/lock files from the revision control system ?
- How can I see if a file is read-only?
- How can I open a file in DVT from the terminal?
- How can I open a file in DVT from Questa?
- How do I change the name of the xterm opened by a DVT Generic Run Configuration?
- I get errors while installing or updating a plugin from an update site
- What is New?
- > How to Report an Issue?
- Legal Notices
- Third Party Licenses
You can send an issue report right from the DVT GUI using the Report an Issue dialog. Along with a problem description, we often need logs and system information in order to reproduce a problematic behavior and fix it.
Go to menu Help > DVT Quick Help > Report an Issue or simply click the toolbar button:
Fill in the identification data (will be remembered for future reports) and issue description. Attach screenshots, code snippets or any other files you consider helpful in reproducing the problem. By default various application logs and diagnostic files are attached. You can preview any attachment using the magnifier icon.
When you click 'Send', an e-mail is sent to support@amiq.com with your own address in CC. You can also save the issue report as a zip archive, and send it manually to support@amiq.com (for example if you don't have Internet connectivity on the machine where DVT runs).
The most useful debug information when dealing with performance issues is a JVM thread dump. Most likely this will help us pinpoint the problem and provide a fast solution.
How to generate a thread dump from within DVT Eclipse?
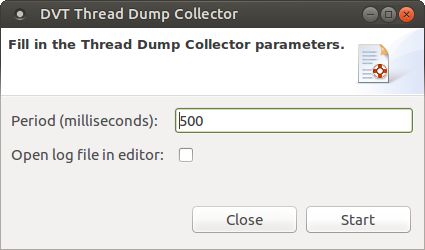
To generate a thread dump from within DVT go to Help > DVT Quick Help > Thread Dump Collector. Start the collector, then do the operation that causes the performance issue and afterwards stop the process from the same dialog.
You can also use the Start Thread Dump Collector and Stop Thread Dump Collector shortcuts from the Quick Access bar (Ctrl+3). The thread dump is generated in the directory of the currently selected DVT project.
How to generate a thread dump from outside DVT Eclipse?
Assuming the DVT GUI is frozen, you can still generate a thread dump by running a script. Open a terminal, log into the machine where DVT runs and run the following command:
$DVT_HOME/bin/dvt_debug_utils.sh -workspace <dvt_workspace_location> -thread_dump -nof_kills 60 -tbs 500ms
The thread dump file is generated in the <dvt_workspace_location>.
How to generate a thread dump for Verissimo & Specador running in batch mode?
Open a terminal and log into the machine where Verissimo/Specador runs. Identify the PID of the Verissimo/Specador java process, for example:
ps aux | grep ro.amiq.dvt.main.specador.SpecadorMain
ps aux | grep ro.amiq.vlogdt.main.VerissimoMain
Run the following command:
$DVT_HOME/bin/dvt_debug_utils.sh -pid <PID> -thread_dump -nof_kills 60 -tbs 500ms
The thread dump is generated in the current directory.
Note: Thread dumps can be automatically generated for specific named actions that the tool performs using the +dvt_profile+<name>[ +<name>][ +<period_ms>] build configuration directive, where <name> is one of: VLOG_RI, VLOG_RC, VLOG_RD, VLOG_US, VLOG_EP, VLOG_CP, VHDL_RU, VHDL_RT, VHDL_RD, VHDL_US, VHDL_USBD, VHDL_CP, ELAB, UNEL, ALL.