- Installation Checklist
- Predefined Projects
- Getting Started
- What is a Workspace
- What is a Project
- Project Natures
- Workspace and Workbench
- Refresh
- Linked Resources
- Backup and Local History
- Basic Tutorial
- Switch to the DVT Perspective
- Open a Project
- Configure the Build
- Build the Project
- Inspect the Compilation Errors
- See Comments in Tooltips
- Use Hyperlinks to Move Around in the Code
- Quickly Open a Type (Entity, Architecture)
- Quickly Open a File
- Quickly Move Inside the Editor
- Inspect the Design Hierarchy
- Browse Through All the Available Types (Entities, Architectures)
- Search for Entities
- Use Content Assist (Autocomplete)
- Use Code Templates
- Use Component Auto Instance
- Track Tasks using TODO Markers
- Quickly See the Current Scope in the Status Bar
- Fold Code Regions in Order to Improve Readability
- Access the Context Sensitive Help
- Build Configurations
- Non-top files
- default.build
- Auto-config
- Simulator Log-config
- Emulating compiler invocations
- Multiple .build Files
- Compatibility Modes
- Paths
- Strings
- Comments
- Environment Variables
- Including Other Argument Files
- Build Persistence
- DVT Auto-Linked
- Run a Script Before Build
- All Build Directives
- e Language Test Files
- e Language SPECMAN_PATH
- SystemVerilog OVM or UVM Library Compilation
- Xilinx Libraries Compilation
- Intel(Altera) Quartus Libraries Compilation
- Questa Libraries Compilation
- Use of External Programs
- Compile Checks
- Content Assist (Autocomplete)
- Quick Fix Proposals
- Add Case Choice
- Add Generic to Entity
- Add Port
- Add Signal to Sensitivity List
- Correct Spelling In Comments and Strings
- Create File From Build Config Editor
- Declare Enum Value
- Declare Variable
- Did You Mean
- Fully Qualify Type
- Import Type
- Replace Deprecated Package
- Remove Library Clause
- Remove Signal from Sensitivity List
- Remove Signal Never Used
- Update Entity Instance
- Waive Compilation Problems
- Content Filters
- Code Templates
- File Templates
- Project Templates
- Code Formatting
- Component Automatic Instantiation
- Semantic Search
- Show Usages, Readers or Writers
- Favorite Searches
- Show Instances
- Quick Search in Views
- Trace Connections
- Breadcrumb Navigation Bar
- Code Factory
- Refactoring
- Diagrams
- Low Power Format Support
- Export HTML/PDF Documentation
- External Tools Integration
- > Debugger Integration
- Custom Dialogs
- Command Line Interface
- dvt_cli.sh
- Syntax
- Examples
- Makefile Example
- Commands
- Create a Project (Mixed-Language Capable)
- Create a Project From an Existing Template
- Import an Existing Project
- List Compiled Files
- Compare Files
- Launch a Run Configuration
- Open a File
- Close a File
- Open a Custom Dialog
- Open a Perspective
- Refresh a Project
- Rebuild a Project
- Print Edited File
- Quit
- Query the running status
- Print version
- Run Performance Exploration
- Reminders (TODO Markers)
- Settings Management
- Reference
- Comments Formatting
- Common Shortcuts
- Custom Pragmas
- DVT Resource Monitor
- Editor Right Click Menu
- Hyperlinks
- Icons and Decorations
- Lazy Bring up Resources
- Memory Monitor
- Scripts
- Syntax Coloring
- Inactive generates code highlight
- Themes
- Toolbar Actions
- Tooltips
- Views
- Application Notes
- Tips and Tricks
- Q & A
- I am new to Eclipse, where should I start from?
- Where can I find DVT Help?
- How do I see and configure the key shortcuts?
- Are there any backup files in Eclipse?
- Workspace in use, cannot launch eclipse...
- Locking is not possible in the directory...
- How to start DVT Eclipse with a different eclipse.ini
- Save could not be completed
- IBM Clearcase Plugin
- How to use Working Sets for filtering Problems/Task/Search views?
- How do I Access Files Outside Project Dir - Working with Linked Resources
- Mapping Linux to Windows (/proj/ to Z:\proj\)
- Subversive vs Subclipse
- How do I associate a project with both DVT and CDT?
- Can I use vi/vim along with DVT?
- Can I perform dos2unix or unix2dos from DVT?
- How can I configure Eclipse to use a local CVS repository?
- I am using the Common Desktop Environment via Citrix and experiencing crashes. What can I do?
- How do I change the background color of the Editor?
- Some widget colors are not displayed properly. What can I do?
- How do I change the tooltip colors?
- How do I change Internet Proxy Settings?
- Eclipse does not start, there is no Workspace, metadata or log file created
- Workspace permissions
- How do I link mylyn with Bugzilla?
- How do I print source code?
- How do I disable Eclipse Software Sites?
- How do I revert to a previous version?
- What are the most common shortcuts in DVT?
- How does DVT integrate with CVS?
- How to set an environment variable within a Run Configuration?
- How to run a remote Unix command from DVT Eclipse for Windows?
- Rebuild shortcut (Ctrl + Alt + R) does not work
- I want to use an alias in a DVT Generic Run Configuration, but it's not recognized
- How to set multiple paths as sources of predefined projects ?
- Lines are suddenly changing indentation when I edit text or move the cursor through the editor.
- How to change the directory where the build log file is saved ?
- How to find the DVT logs on Linux/Unix ?
- How to create resource filters ?
- How to create custom shortcut and button for a Run Configuration?
- I know that file.foo is present in the project location, but I can't see it in the Navigator View
- How to copy the full path to the file in the current editor?
- How to adjust the console logs filters matching parameters?
- When I switch to Block (Column) Selection mode the font changes
- In Block (Column) Selection mode I see strange editng artifacts
- How to modify the font size in the code editors?
- How to automatically checkout/lock files from the revision control system ?
- How can I see if a file is read-only?
- How can I open a file in DVT from the terminal?
- How can I open a file in DVT from Questa?
- How do I change the name of the xterm opened by a DVT Generic Run Configuration?
- I get errors while installing or updating a plugin from an update site
- What is New?
- How to Report an Issue?
- Legal Notices
- Third Party Licenses
In order to launch a new debug simulation from DVT you just need to define a DVT Generic Debug Configuration from menu Run > Debug Configurations... > as shown in the snapshot below. Then you click Debug.
The launch command can be any script that invokes your simulation. Just remember the Simulation Prerequisites. You can find examples in the DVT Predefined Projects.
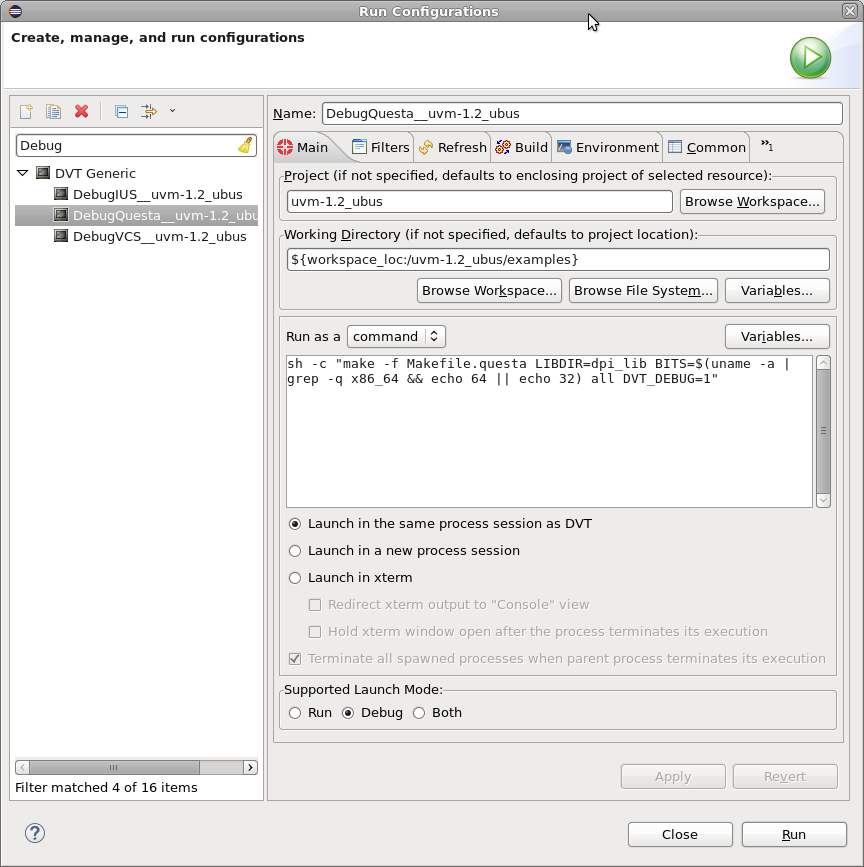
NOTE: You may chose the supported launch mode for the configuration: Run, Debug or Both. When launched in Debug mode, the environment of the executed process contains the DVT_LAUNCH_MODE variable set to 'generic_debug'.
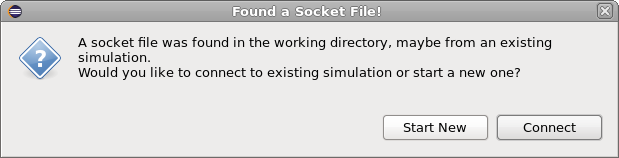
As soon as you launch the simulation, DVT waits for the simulator communication socket to be ready. It polls the working directory for a file which contains the socket details (host and port).
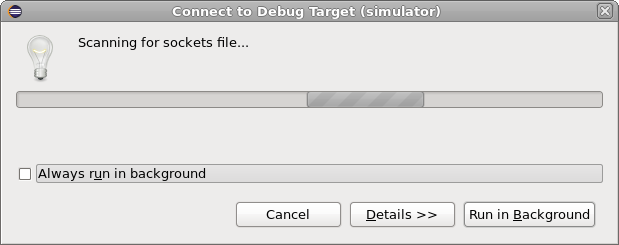
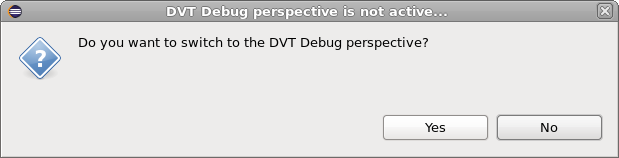
As soon as the sockets file is found, DVT prompts you to switch to the DVT Debug perspective, which is a specific GUI layout for debugging activities.
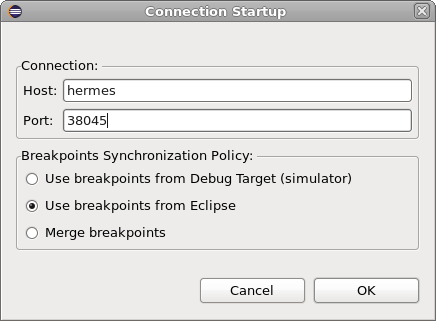
Finally a dialog pops up, it presents the connection info and allows you to chose the breakpoints handling policy.
If disconnected
If you got disconnected, you can always launch again in Debug Mode, you'll be presented with the option to re-connect.
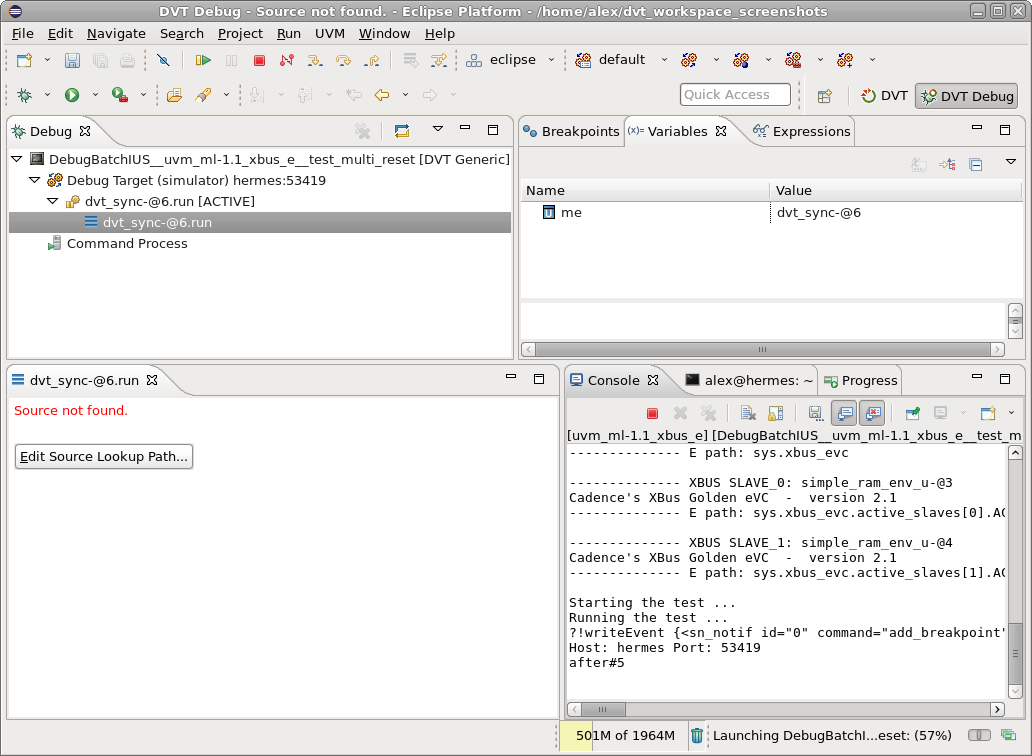
dvt_sync (e Language Only)
Assuming your script starts the simulation, you'll see the debugger stopped inside a dvt_sync encrypted module. This is used for initial handshake with Specman. Without it the simulation will proceed without DVT being able to send over information to Specman. It also allows you to add breakpoints, if you didn't already.
Just click Continue. The simulation will stop at the next breakpoint.