DVT SystemVerilog IDE User Guide
Rev. 24.1.9, 26 April 2024
- Installation Checklist
- Predefined Projects
- Getting Started
- What is a Workspace
- What is a Project
- Project Natures
- Workspace and Workbench
- Refresh
- Linked Resources
- Backup and Local History
- Basic Tutorial
- Switch to the DVT Perspective
- Open a Project
- Configure the Build
- Build the Project
- Inspect the Compilation Errors
- See Comments in Tooltips
- Use Hyperlinks to Move Around in the Code
- Quickly Open a Type (Class, Module, Interface)
- Quickly Inspect the Class Hierarchy
- Quickly Open a File
- Quickly Move Inside the Editor
- Inspect the Class Hierarchy and Class Members
- Inspect the Design Hierarchy
- Inspect the Verification Hierarchy
- Browse Through All the Available Types (Classes, Modules, Interfaces)
- Look for the Implementation of an Extern Function or Task
- Search for Entities
- Use Content Assist (Autocomplete)
- Use Code Templates
- Use Module Auto Instance
- Expand Macros (Apply Preprocessing)
- Trace Macro Errors
- Track Tasks using TODO Markers
- Quickly See the Current Scope in the Status Bar
- Fold Code Regions in Order to Improve Readability
- Access the Context Sensitive Help
- Build Configurations
- Non-top files
- default.build
- Auto-config
- Simulator Log-config
- Emulating compiler invocations
- Multiple .build Files
- Compatibility Modes
- Paths
- Strings
- Comments
- Environment Variables
- Including Other Argument Files
- Build Persistence
- DVT Auto-Linked
- Run a Script Before Build
- All Build Directives
- e Language Test Files
- e Language SPECMAN_PATH
- SystemVerilog OVM or UVM Library Compilation
- Xilinx Libraries Compilation
- Intel(Altera) Quartus Libraries Compilation
- Questa Libraries Compilation
- Use of External Programs
- Compile Checks
- Content Assist (Autocomplete)
- Quick Fix Proposals
- Add Parameter to Module
- Add Port to Module
- Add Signal to Sensitivity List
- Add Virtual Qualifier to Interface Type
- Correct Spelling In Comments and Strings
- Create Class In New File
- Create File From Build Config Editor
- Create Included File
- Create Interface Class In New File
- Declare Method
- Declare Variable
- Did You Mean
- Explicitly Declare
- Fully Qualify Type
- Implement Extern Method
- Implement Missing Pure Virtual Methods
- Import Type
- Remove 'local' or 'protected' Qualifier
- Remove Signal from Sensitivity List
- Remove Signal Never Used
- Update Extern Prototype/Implementation
- Update Module Instance
- Update Virtual Method Signature
- Waive Compilation Problems
- Quick Assist Proposals
- Bind Method Call Arguments by Name
- Bind Method Call Arguments by Position
- Connect Instance Ports by Name
- Connect Instance Ports by Position
- Expand .* Port Connections
- Extract to Variable
- Extract to Method
- Extract to Module
- Move Selection to New File
- Join Extern and Implementation
- Split to Extern and Implementation
- Rename in File
- Content Filters
- Code Templates
- File Templates
- Project Templates
- Code Formatting
- Override Functions
- Generate Getters and Setters
- Module Automatic Instantiation
- Semantic Search
- Show Usages, Readers or Writers
- Favorite Searches
- Show Constraints
- Show Instances
- Quick Search in Views
- Trace Connections
- Breadcrumb Navigation Bar
- Code Factory
- Refactoring
- Rename Refactoring
- Rename Port Across the Design Hierarchy
- Rename File
- Bind Method Call Arguments by Name
- Bind Method Call Arguments by Position
- Connect Instance Ports by Name
- Connect Instance Ports by Position
- Expand .* Port Connections
- Extract to Variable
- Extract to Method
- Extract to Module
- Move Selection to New File
- Join Extern and Implementation
- Split to Extern and Implementation
- Change Method Signature
- Connect Instances Across the Design Hierarchy
- Add Port to Module from Selected Field
- Add New Port to Module
- Add New Parameter to Module
- Refactoring Scripts
- Diagrams
- Low Power Format Support
- Export HTML/PDF Documentation
- External Tools Integration
- Debugger Integration
- Custom Dialogs
- Command Line Interface
- dvt_cli.sh
- Syntax
- Examples
- Makefile Example
- Commands
- Create a Project (Mixed-Language Capable)
- Create a Project From an Existing Template
- Import an Existing Project
- List Compiled Files
- Compare Files
- Launch a Run Configuration
- Open a File
- Close a File
- Open a Custom Dialog
- Open a Perspective
- Refresh a Project
- Rebuild a Project
- Print Edited File
- Quit
- Query the running status
- Print version
- Run Performance Exploration
- Macros Support
- Reminders (TODO Markers)
- OVM Support
- UVM Support
- VMM Support
- Settings Management
- > Reference
- Comments Formatting
- Common Shortcuts
- Custom Pragmas
- DVT Resource Monitor
- Editor Notification
- Editor Right Click Menu
- Hyperlinks
- Icons and Decorations
- Inactive Generates Code Highlight
- Lazy Bring up Resources
- Memory Monitor
- Scripts
- Syntax Coloring
- Themes
- Toolbar Actions
- > Tooltips
- Views
- Call Hierarchy View
- Checks View
- Code Templates View
- Compile Order View
- Config DB View
- Console View
- Coverage View
- Design Hierarchy View
- Factory Overrides View
- Inspect View
- Layers View
- Macros View
- Outline View
- Problems View
- Registers View
- Tasks View
- Trace Connections View
- Types View
- Type Hierarchy View
- UVM Browser View
- UVM Sequence Tree View
- Verification Hierarchy View
- Application Notes
- C/C++ support
- Design Elaboration
- Compilation Speed-up
- Precompilation Support
- Encrypted VIP Support
- FPGA Support
- Generating External Tool Scripts from the DVT Build Configuration
- Incremental Compilation
- Preprocessed Files Support
- Output and logging
- UVM Library Compilation Troubleshooting
- Visual Artifacts
- Tips and Tricks
- Q & A
- I am new to Eclipse, where should I start from?
- Where can I find DVT Help?
- How do I see and configure the key shortcuts?
- Are there any backup files in Eclipse?
- Workspace in use, cannot launch eclipse...
- Locking is not possible in the directory...
- How to start DVT Eclipse with a different eclipse.ini
- Save could not be completed
- IBM Clearcase Plugin
- Non existing package mti_fli
- How to use Working Sets for filtering Problems/Task/Search views?
- How to handle Simulator and Command Line Macros
- How do I Access Files Outside Project Dir - Working with Linked Resources
- Mapping Linux to Windows (/proj/ to Z:\proj\)
- Subversive vs Subclipse
- How do I associate a project with both DVT and CDT?
- Can I use vi/vim along with DVT?
- Can I perform dos2unix or unix2dos from DVT?
- How can I configure Eclipse to use a local CVS repository?
- I am using the Common Desktop Environment via Citrix and experiencing crashes. What can I do?
- How do I change the background color of the Editor?
- Some widget colors are not displayed properly. What can I do?
- How do I change the tooltip colors?
- How do I change Internet Proxy Settings?
- Eclipse does not start, there is no Workspace, metadata or log file created
- Workspace permissions
- How do I link mylyn with Bugzilla?
- How do I print source code?
- How do I disable Eclipse Software Sites?
- How do I revert to a previous version?
- What are the most common shortcuts in DVT?
- How does DVT integrate with emacs?
- How does DVT integrate with CVS?
- How to set an environment variable within a Run Configuration?
- How to run a remote Unix commnad from DVT Eclipse for Windows?
- Rebuild shortcut (Ctrl + Alt + R) does not work
- I want to use an alias in a DVT Generic Run Configuration, but it's not recognized
- How to set multiple paths as sources of predefined projects ?
- Lines are suddenly changing indentation when I edit text or move the cursor through the editor.
- How to change the directory where the build log file is saved ?
- How to find the DVT logs on Linux/Unix ?
- How to create resource filters ?
- How to create custom shortcut and button for a Run Configuration?
- I know that file.foo is present in the project location, but I can't see it in the Navigator View
- How to copy the full path to the file in the current editor?
- How to adjust the console logs filters matching parameters?
- When I switch to Block (Column) Selection mode the font changes
- In Block (Column) Selection mode I see strange editng artifacts
- How to modify the font size in the code editors?
- How to automatically checkout/lock files from the revision control system ?
- How can I see if a file is read-only?
- How can I open a file in DVT from the terminal?
- How can I open a file in DVT from Questa?
- How do I change the name of the xterm opened by a DVT Generic Run Configuration?
- I get errors while installing or updating a plugin from an update site
- What is New?
- How to Report an Issue?
- Legal Notices
- Third Party Licenses
A tooltip is a brief, informative message that appears when a user interacts with an element in a graphical user interface (GUI). In DVT tooltips are initiated through a mouse-hover gesture.
The bellow table highlights all the available areas from where tooltips can be triggered:
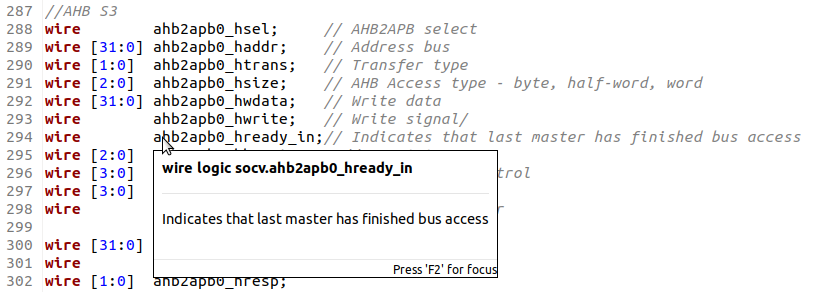
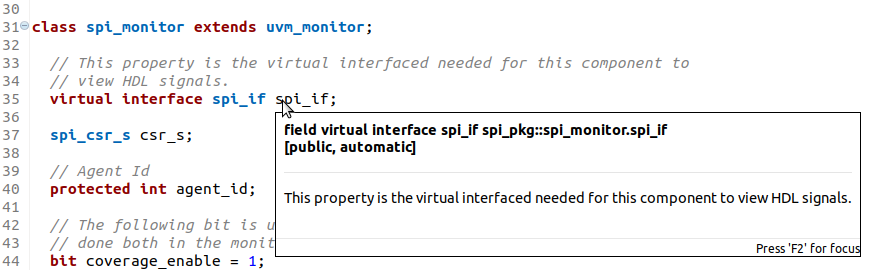
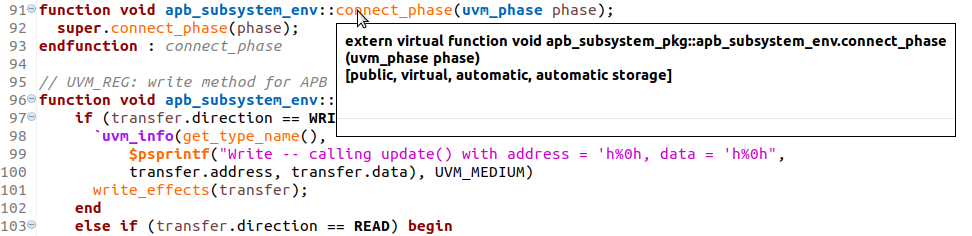
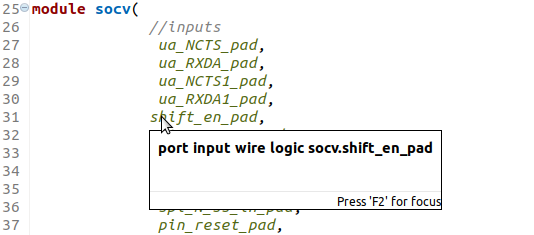
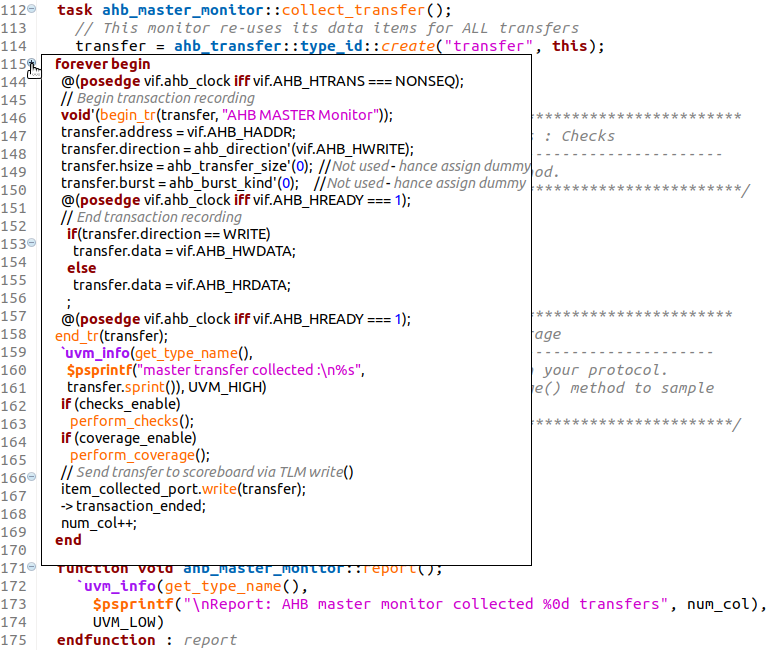
| Code | Place the mouse cursor over an identifier in the editor. The tooltip will display information about the element under cursor including:
|
| Folded regions | Place the mouse cursor over the
+ sign of a folded code region. The tooltip will display the folded region contents:
 |
| Macros Values |
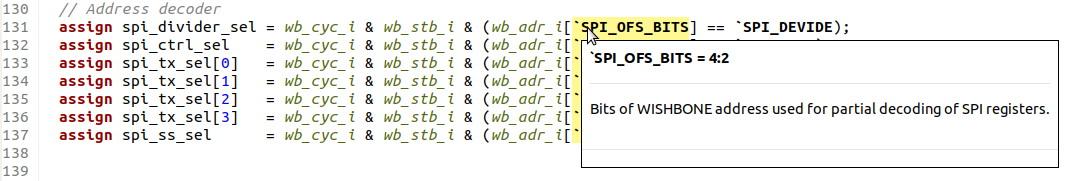 |
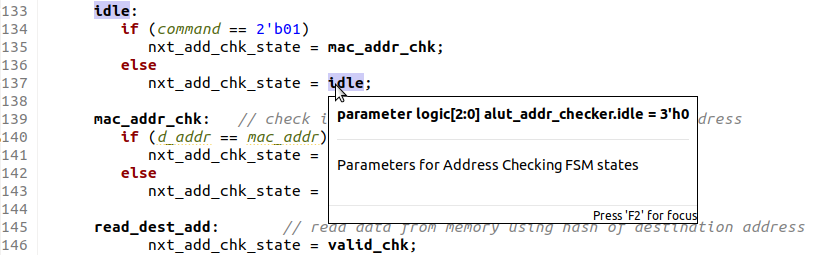
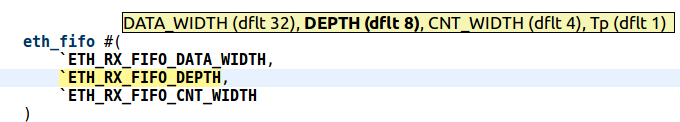
| Parameter Values |
 |
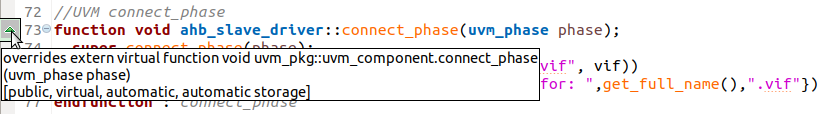
| Override indications | Place the mouse cursor over an override annotation on the left vertical ruler. The tooltip will display the overridden method signature.
 |
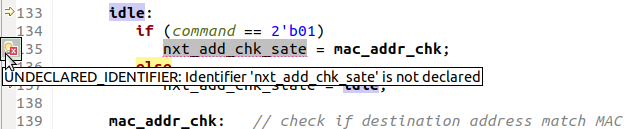
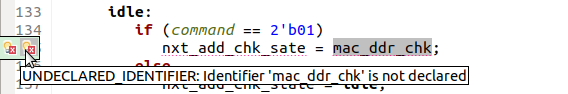
| Problems | Place the mouse cursor over an error or warning annotation on the left vertical ruler of the editor. The tooltip will display the error or warning message:
 |
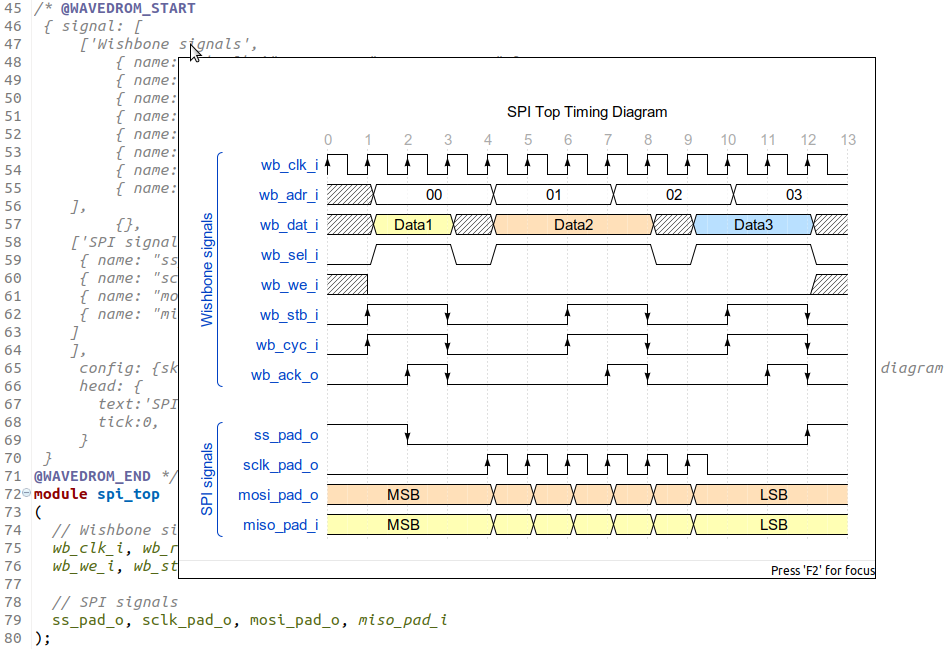
| WaveDrom Diagrams | Place the mouse cursor over a JSON waveform description written inside a comment. The tooltip will display
WaveDrom Timing Diagrams, if the descriptions are compliant with the WaveDrom library standard:
 |
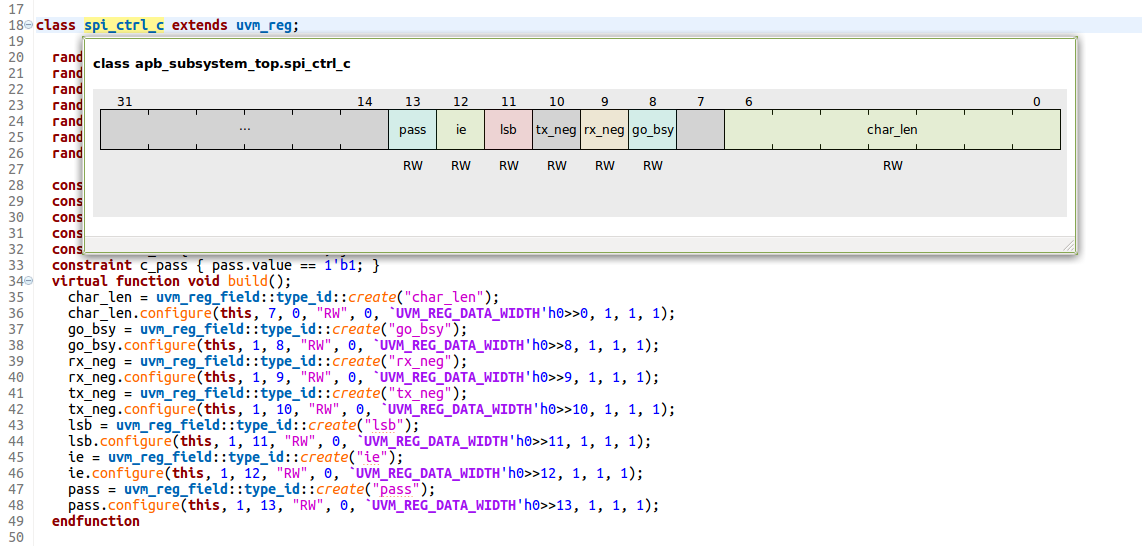
| UVM Register Bit Field Diagrams | Place the mouse cursor over an UVM register class. The tooltip will display bit field diagrams, by parsing the UVM configuration methods:
 |
|
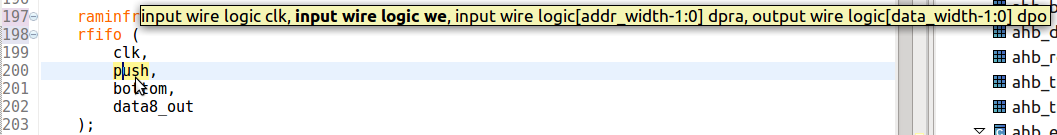
Method Call Arguments Mapping
| Place the editor cursor on a method call argument and press
Ctrl + Shift + Space. The tooltip will list all the method declaration arguments along with their name, type, direction and default value. Move the editor cursor using the arrow keys to inspect argument mapping - the argument under cursor is always highlighted in boldface:


 |